
The queue that never drains
On a telemetry platform, GPS devices send their positions to TCP gateways; the gateways publish them to RabbitMQ; consumer services take them, store them in MySQL, and Socket.IO delivers them to the applications. There are dedicated queues for positions, for JT808 events, for alarms and for other messages.
The queue is there so that each piece does its job without waiting for the next one: the gateway keeps receiving even if the database is busy, and the consumer works at its own pace. But a message queue lets you decouple systems; it does not remove capacity problems, and on its own it does not guarantee the integrity of the information.
I wanted to see that measured, not told. I have no documented incident of a queue piling up for hours, and no confirmed cause of saturation, and I am not going to blame RabbitMQ, the database or a consumer without records that show it. So I set it up in the lab.
Everything in this note was measured on October 29, 2026 on an Intel N100 (4 cores, 8 GB, a 128 GB NVMe drive), with an isolated RabbitMQ 3.12.1 and synthetic messages shaped like a position: no production queues and no data from real devices. Persistence is SQLite, not MySQL: the N100 does not have MySQL. The figures belong to this machine; another server will have other numbers.
The rule: acknowledge after storing
The lab consumer follows one rule: it acknowledges the message (the ACK) only
after the position has been stored. SQLite in WAL mode with
synchronous=FULL and one commit per message: when the consumer acknowledges,
the position is already on disk.
And it is worth knowing what that ACK says. It does not show that the device received anything, or that the application already has the data: only that the consumer acknowledged the message to the broker. With that, RabbitMQ deletes it. If the consumer dies before acknowledging, RabbitMQ delivers it again.
The prefetch limits how many unacknowledged messages the consumer holds at a time. In the lab, 10.
When more comes in than goes out
The math is simple. If 1,000 messages a second come in and only 800 can be processed, 200 a second pile up. RabbitMQ keeps them as long as it has resources, but the problem keeps growing.
First I measured how much the consumer processes: with a queue preloaded with 10,000 messages, it drained 1,095 a second. Then I put a producer at a fixed rate, two minutes per test (rates from the second minute):
| In | Out | The backlog |
|---|---|---|
| 1,041/s | 1,041/s | does not grow |
| 1,150/s | 1,122/s | grows 28 a second |
| 1,314/s | 1,103/s | grows 211 a second |
The last one is the example’s math, measured: 211 a second more come in than go out, and the backlog grows by exactly that. At the end of those two minutes, the positions being stored had been waiting in the queue for 18 seconds. Nothing failed: no errors, no lost messages. Just data getting older and older.
Short-test capacity is not sustained capacity
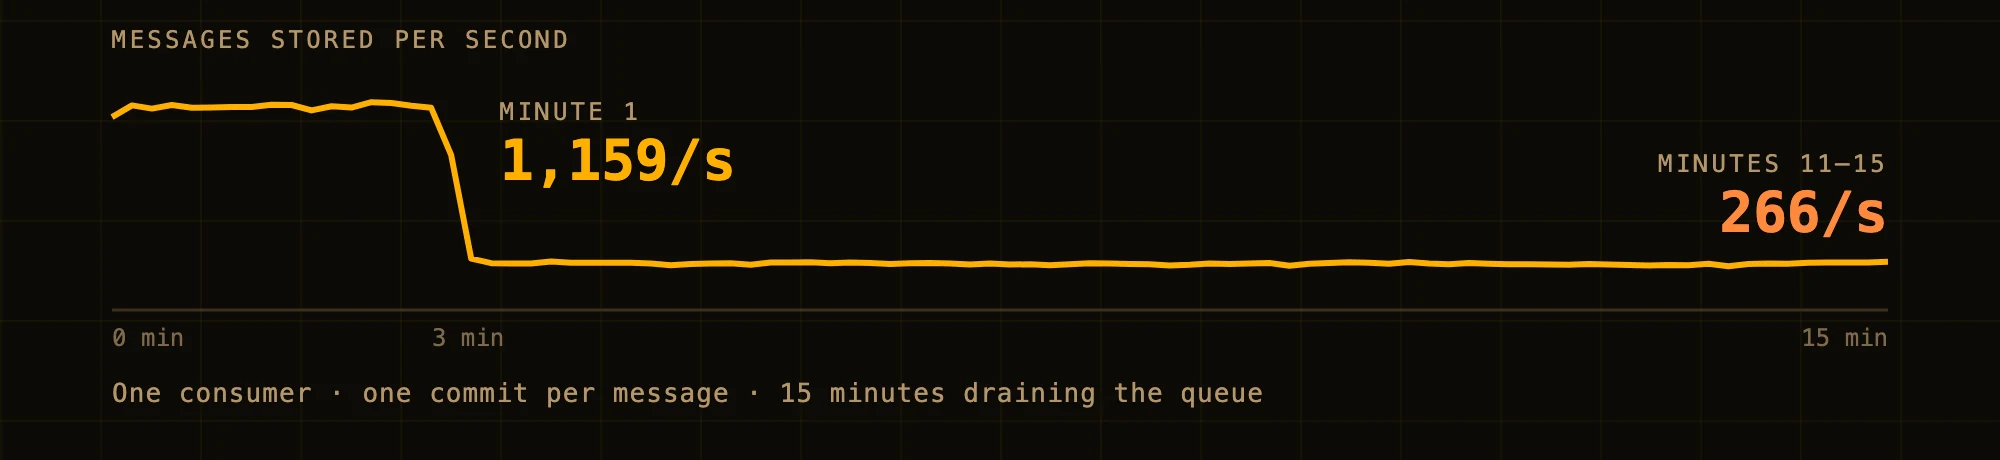
Up to here, 1,095 a second looked like the consumer’s capacity. Then I left a single consumer draining a large queue for 15 minutes:
| Minute | 1 | 2 | 3 | 4 | 5 to 15 |
|---|---|---|---|---|---|
| Stored per second | 1,159 | 1,169 | 1,130 | 275 | 261 to 272 |
After three minutes, capacity dropped to a quarter and stayed there: an average of 266 a second over the last five.
Nothing points to the processor: the temperature stayed around 46 °C on average in both phases, and the average frequency went down, from 1,727 to 1,441 MHz, the way it does when there is less work. What changed was the disk: the NVMe went from about 3,200 writes a second, at a median of 0.5 ms, to about 835, at 1.75 ms, with peaks of 11.5 ms. Why it slows down inside, I do not know: it is a drive without its own DRAM, and the suspect is its cache, but I did not verify it. What I did measure is that rest brings it back: after a 30-second pause, it was back above 1,000 a second.
Then I put the producer at a fixed rate, ten minutes per test, starting with a rested disk:
- 213, 253 and 293 a second: caught up for all ten minutes; no position waited more than 34 ms.
- 400 a second: caught up for eight minutes; in the ninth it started falling behind, in the tenth about 286 a second went out, and when the producer stopped positions had been waiting 22 s.
At 400 a second—a little over a third of what I had measured in the short test—the queue held for eight minutes and then started to grow. A five-minute load test would have passed it. At 550 and 700 a second, with the disk already tired from the previous test, the consumer dropped to about 300 a second from the second minute on; at the end there were 143,000 and 217,000 messages in the queue, and positions had been waiting more than four and five minutes.
And 293 a second held for ten minutes, but I did not test it any longer: I cannot say it holds for an hour. That it held while being more than 266 says something else: those 266 are what goes out draining at full speed, not a fixed ceiling. When the disk slows down depends on how much you ask of it and on how long it rested before.
The capacity that matters is the one that holds under the real load, for long enough. A short test measures something else.
More consumers barely helped; batching did
The natural reaction is to add consumers. With the queue preloaded:
| Prefetch | 1 consumer | 2 | 4 |
|---|---|---|---|
| 1 | 723/s | 751/s | 897/s |
| 10 | 1,095/s | 1,001/s | 925/s |
| 100 | 1,096/s | 1,104/s | 920/s |
With prefetch 1, more consumers did help: from 723 to 897 a second. With prefetch 10 and 100 they gave the same or less, and with four, less than with one. Raising the prefetch from 1 to 10 helped more than any number of consumers; from 10 to 100 it no longer did. My reading, which I did not measure, is that SQLite writes one at a time and whatever you add competes for the same thing. And each figure is a single run of about nine seconds, exactly the short test of the previous section: it is good for comparing configurations, not as the capacity of any of them.
What changed the scale was acknowledging in batches: storing up to 10 positions in a single commit (or whatever gathers in 50 ms) and, only then, acknowledging them together, with prefetch 20. The rule holds: nothing is acknowledged before it is on disk. Draining a queue of one million, that consumer stored about 7,750 a second, although that was another short test: 129 seconds. With a producer at 3,000 a second for ten minutes, everything went out in the first minute; then it kept dropping, from 2,512 to about 2,000 a second, and the queue reached 448,000. About seven times the sustained capacity of one at a time, but not constant either; I assume because of the disk too, although I did not record it in that run.
Everything points to the bottleneck not being in RabbitMQ, but in what the consumer asks of the disk for each message.
When the consumer goes down
If the consumer stops for a minute and the producer keeps going, the backlog is what arrived in that minute. When the consumer comes back, it drains it with its spare capacity: what it processes minus what keeps arriving. The time to catch up is the backlog divided by that margin.
With the producer at half and at 70 % of the short-test capacity (1,095 a second):
| Load | Backlog on return | Predicted | Measured |
|---|---|---|---|
| 50 % | 32,987 | 60 s | 57 s |
| 70 % | 45,835 | 140 s | 134 s |
(“Caught up”: the positions being stored are back to waiting less than a second.)
The formula works as long as the margin exists. At 50 % load, the margin is half the capacity; at 70 %, less than a third, and the same minute down took more than twice as long to recover.
At 90 %, the predicted margin gave nine minutes. It never recovered. The test started with the disk tired from the previous one: in the first minute, 554 a second went out of 986 coming in. The outage worked as a rest: on return, about 1,100 a second went out for three minutes and the backlog went down. Then it fell to about 300, and after fifteen minutes there were 470,000 messages in the queue. And the 70 % one, after catching up, fell behind again in minute six; that run did not record the disk, but the pattern is the same.
Even after capacity comes back, the whole accumulated backlog still has to be processed. And if the margin is small, that takes much longer than the outage.
The message that never leaves
An invalid message—broken JSON—always fails. The question is what the consumer does with it. I tried three policies, with a producer at half the short-test capacity for one minute and three special messages: one invalid, one with a transient failure that recovers on the third attempt, and one that never recovers.
Put it back in the queue. The invalid one was redelivered 233,330 times in a minute, about 3,850 a second. And the queue looked healthy: 0 messages ready, between 1 and 3 unacknowledged, the other positions going out at 548 a second. An alert that only looked at how many messages are in the queue would never have fired. The symptom was in the redelivery rate: thousands of deliveries a second of a message that is never going to be stored.
Send it to the dead-letter queue (DLQ) on the first failure. The invalid one went to the DLQ, which is correct. But so did the transient one: a good position, lost in the DLQ because of a failure that would have cleared up on its own on the third attempt.
Tell them apart. Invalid: to the DLQ right away, because retrying does not fix it. Transient failure: wait one second in another queue and try again, up to three attempts. The transient one was stored on the third attempt; the one that never recovers reached the DLQ when it ran out of attempts.
And a detail that matters: in this lab, the only thing that reaches the DLQ is what the consumer rejects without requeuing, because that is how the queue is configured. In general, RabbitMQ also sends there messages whose time to live expired or that exceed the queue’s maximum length, if the queue is configured for it; this lab’s retries use exactly that, a one-second time to live. Nothing reaches a DLQ that nobody configured.
Stored, but not acknowledged
The most awkward case: the consumer stores the position, and before acknowledging it goes down. RabbitMQ did not get the ACK, so it delivers it again, and the consumer stores it again.
I caused it five times in a minute, with two tables:
| Table | Crashes | Extra rows |
|---|---|---|
| no key | 5 | 5 |
| key (device, event time) | 5 | 0 |
In the run with the key there were 22 redeliveries (21 in the run without it): the five messages already stored and the ones the consumer was holding unacknowledged. With the key, the five messages already stored were detected as duplicates and not inserted. Without it, five positions were stored twice: a route with repeated points, an alarm counted twice.
RabbitMQ does not guarantee that each business operation runs exactly once. The guarantee has to be in the persistence: an event identifier or a composite key that makes sense for the protocol.
What to watch
An empty queue is not, on its own, a sign of health: with the poison message, the queue was empty. And a queue with messages does not mean something is failing either: after an outage, a shrinking backlog is the system recovering.
What does tell you something:
- the incoming rate against the outgoing rate, sustained, not over one minute;
- the age of the oldest message, which is what turns a backlog into data that is no longer useful;
- how long it takes to catch up after an outage;
- redeliveries and the state of the consumers, not just how many are connected.
What we do not know
- Production. None of this is a production measurement. I do not know where the consumers acknowledge today or with what prefetch, and the retry, expiration and monitoring policies of the DLQs are not documented uniformly.
- The disk. Why the NVMe slows down after a few minutes of one commit per message is a hypothesis. Here, also, the broker and the database write to the same disk; on a server with separate disks, the numbers may change.
- Longer runs. No test with a producer lasted more than fifteen minutes. That 293 a second held for ten minutes says nothing about an hour.
- MySQL. Persistence was SQLite. I expect the phenomenon to be the same—capacity is set by what the consumer asks of the database for each message—but I did not measure it.
- The queue type. These were classic queues on RabbitMQ 3.12, a version that no longer gets community support. Quorum queues store and replicate differently.
What I would do
- Measure the consumer’s sustained capacity under the real load for long enough, not in a one-minute test. And measure it again when the database, the disk or the volume changes.
- Acknowledge after storing, with idempotent persistence: the ACK can get lost, and the redelivery will come.
- Acknowledge in batches when the cost per message is in the commit, without breaking the rule.
- Separate the invalid from the transient: invalid to the DLQ right away; transient, retries with a wait and a maximum.
- Alert on age and on rates, not just on queue depth.
The code, the lab configuration and the series from the three runs are in the repository.
The real problem is not having messages waiting. It is the system piling up work faster than it can resolve it, and nobody noticing until the information is no longer timely.
Israel Negrete Lepe is an electronics engineer. Twenty-five years making different systems work together under real conditions: from the sensor, the vehicle or the transaction to the backend, the data, security and operations. Today, increasingly, edge AI. I take on projects by the hour or by deliverable: israel0negrete@gmail.com.