
The throttling your system does not show you

In the field I have seen SD cards damaged by heat, and Raspberry Pis that freeze up when the heat builds, especially when the heat of the place is added to the heat of the processing. In the lab, on the other hand, the Pi had never throttled: in the Round 1 tests the highest temperature was 65 °C.
But those tests lasted between three and thirty-one seconds. So I put the Pi and the N100 to work for seventy minutes without a break, recording everything, to see what happens when the model does not rest.
The test
Both devices with their usual cooling: the 8 GB Raspberry Pi 5 with a heatsink and fan inside a metal case, and the 8 GB Intel N100 in its mini PC with a fan. A ventilated room, no direct sun. Both freshly rebooted.
The model, YOLO26n in FP32 with ONNX Runtime, running non-stop in four phases: two minutes idle, thirty with one process using all four cores, ten cooling down, and thirty with four processes of one core each. Every inference is recorded, and every second, the temperature, the frequency the system reports and, on the Pi, two more things only its firmware knows: the real processor clock and the flags it uses to say it is throttling.
What happened on the Pi
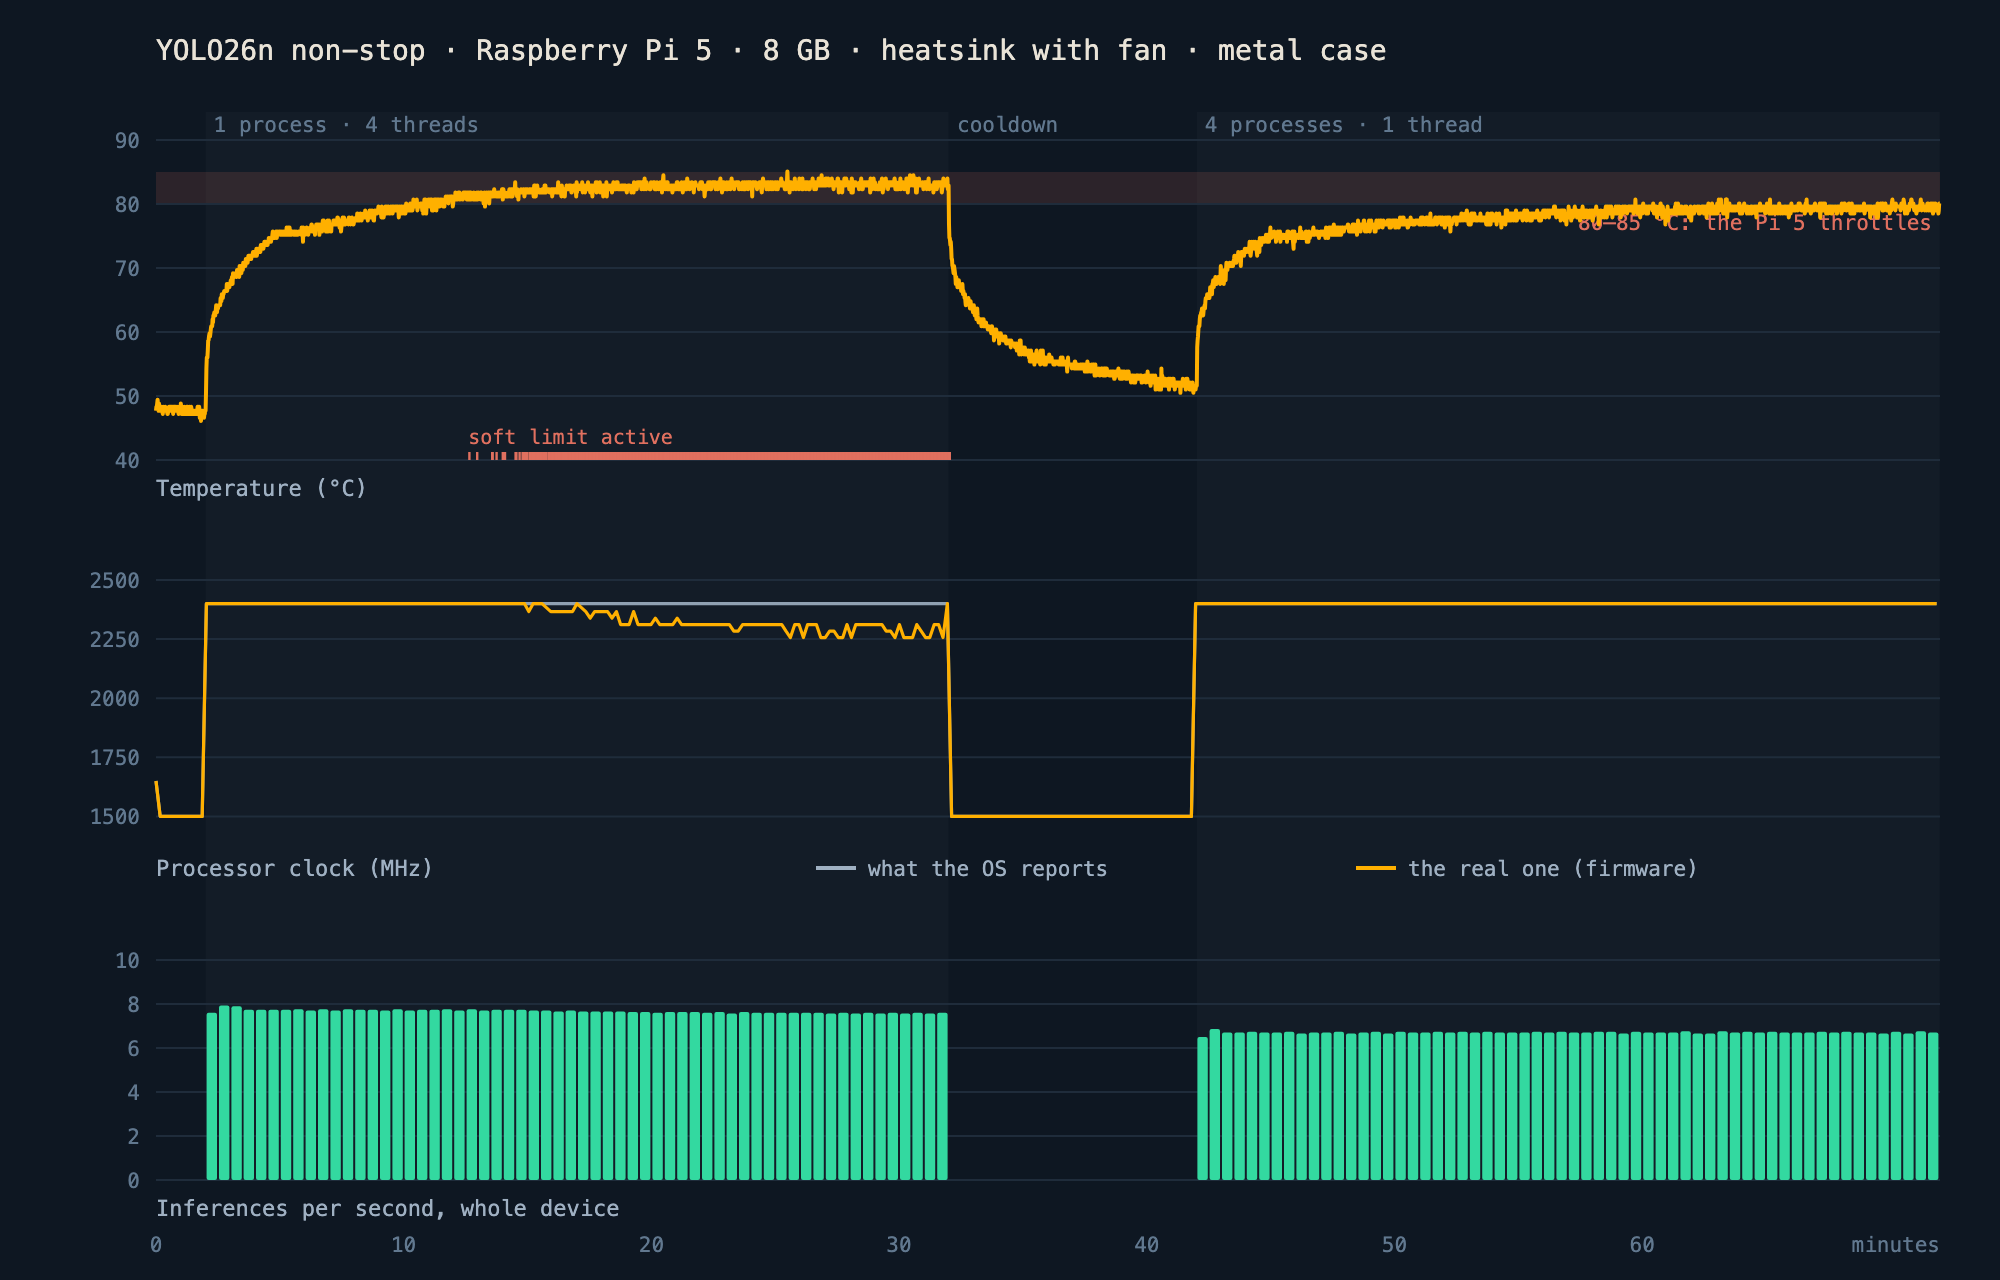
It enters the throttling zone in eight minutes. The Pi 5 starts slowing its cores down between 80 and 85 °C. It reached 80 °C at minute 8, the Pi itself flagged its limit as active at minute 10.6, and it stayed there until the end of the phase, peaking at 85.1 °C.
The system says nothing is happening. The frequency Linux reports stayed at 2,400 MHz for all thirty minutes. The real clock, the one the firmware reports, was below that for half the phase: over the last five minutes it averaged 2,283 MHz, and at moments it dropped to 1,500. That is the gray line against the amber one in the chart.
And the model gets slower, a little. From 7.76 inferences per second at the start to 7.58 at the end: 2.3 % less. Latency went from 128.3 to 131.2 ms. With this cooling, the Pi sustains the work; it pays for it with a few points of speed that no system tool shows.
With four processes, less heat and less work. In the second phase, four single-core processes reached 80.7 °C, the clock did not drop, and the device did 6.7 inferences per second: fewer than the 7.6 of a single process on four cores. On the Pi, splitting the work that way does not pay.
What happened on the N100
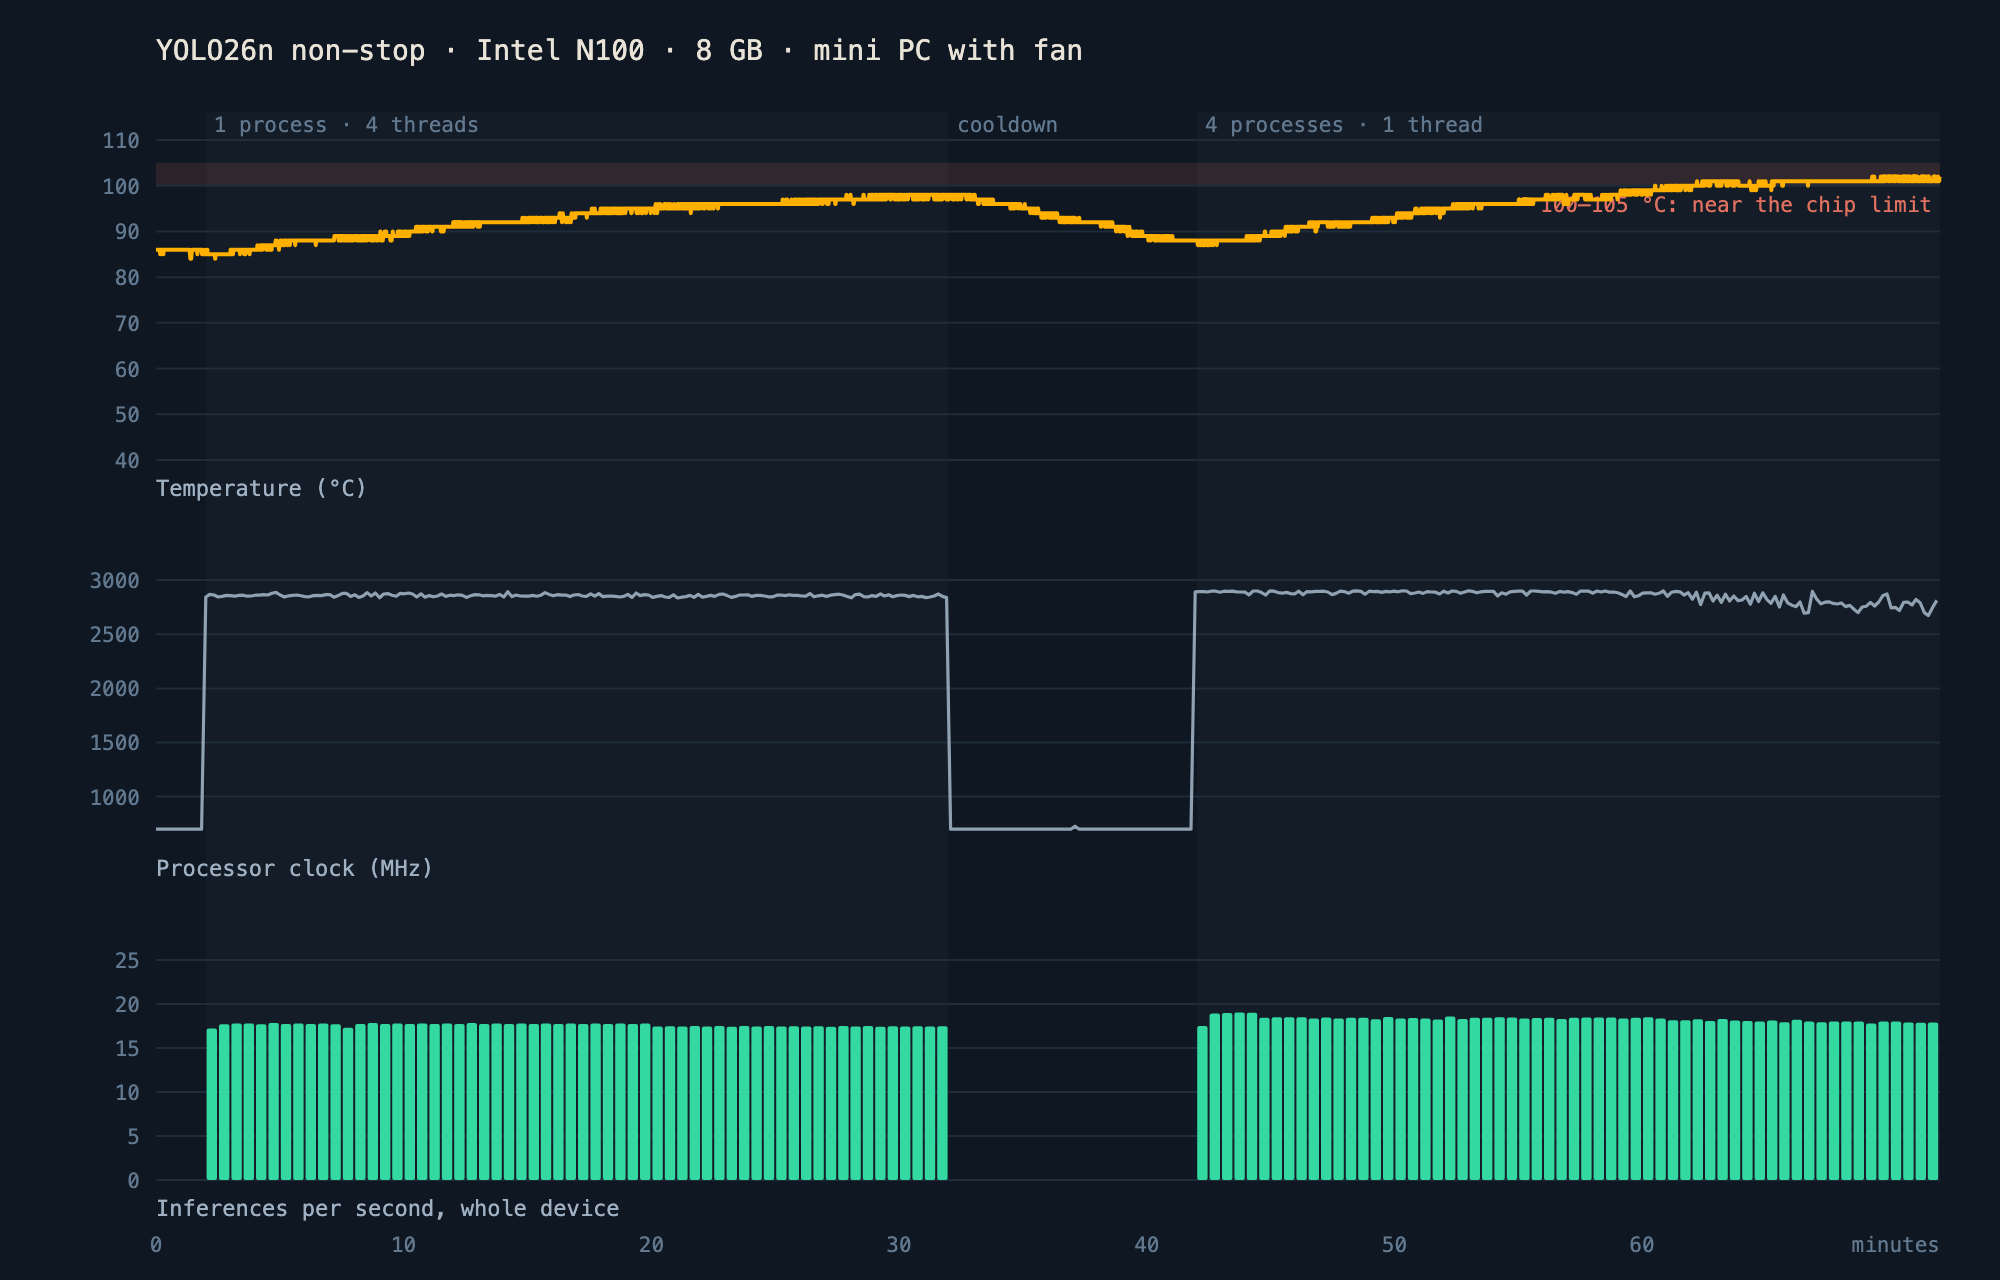
The N100 runs much hotter. With one process it reached 98 °C; with four, 102 °C, close to the chip’s limit of around 105. A caveat on this figure: the N100 started the test already hot, at 85 °C, because it came straight from another measurement; where it ends matters more than where it starts.
There the throttling does show in the frequency: in the four-process phase it dropped from 2,790 to 2,514 MHz, and the device’s speed from 18.7 to 18.0 inferences per second, 3.9 % less, with the latency of each inference rising 4.3 %. Unlike the Pi, on the N100 four processes do a little better than one: 18.7 against 17.7.
What it says
Both throttle under sustained load, even with a fan and in a ventilated room. The cost over thirty minutes was small —between 2 and 4 %— and it keeps growing; it does not stay put.
A test of a few seconds does not see it. With the Round 1 runs, the Pi was at 65 °C and full speed. It is the same Pi.
On the Pi, the system does not show it. If you watch for throttling with the frequency Linux reports, you will see nothing. What does show it is latency, the firmware’s real clock and its throttling flags.
What it does not say
Thirty minutes per phase, not days. A ventilated room, not a cabinet in the sun or a closed box on a pole. One unit of each device. In the field, with more heat and no pauses, all of this moves in the same direction, and further.
And one thing I could not explain: the first time I ran this test, the Pi stopped responding twenty-seven minutes into the four-process phase, with no unusual heat, and did not come back until it was rebooted the next day. In the clean round, with the system log now available to find out why, it did not happen again. Noted, not explained.
What I would do
Measure sustained before promising a latency for the field. Hours, in the enclosure where the device will live, until the temperature stops rising. What you measure there is what you can promise.
Record the temperature, the real clock and the throttling flags with every
measurement. On the Pi, vcgencmd measure_clock arm and
vcgencmd get_throttled. Without them, a benchmark cannot tell a slow model
from a hot device.
Watch for throttling in production. The Pi keeps track of whether it has throttled since the last boot. Putting that in the device’s periodic report costs a few bytes and warns you before the customer notices everything is slower.
Look after storage. An industrial-grade SD card or an SSD, and write to it as little as possible. Heat and writes together are what finish it off.
The data from this test —every inference and every second of temperature, clock and flags from both devices— is at crtdrops.mx/datos, under a CC BY 4.0 licence.
Israel Negrete Lepe is an electronics engineer. Twenty-five years building systems that make it to production: telemetry, vehicle tracking, municipal video surveillance, RFID asset control and transactional platforms.